KPI
The KPI (Key Performance Indicators) view provides a snapshot of key printer performance metrics—such as availability, utilization, print volume, ink consumption, and error rates. It's designed to help you evaluate efficiency and identify opportunities for improvement.
At the top, you’ll find two main panels:
- Left side: Aggregated Statistics: based on your selected timeframe in the global filters.
- Right side: Lifetime Totals: showing data from the printer’s installation to the current day.
Aggregated Statistics
The left section is divided into:
- Productivity
- Workload
- Ink Usage
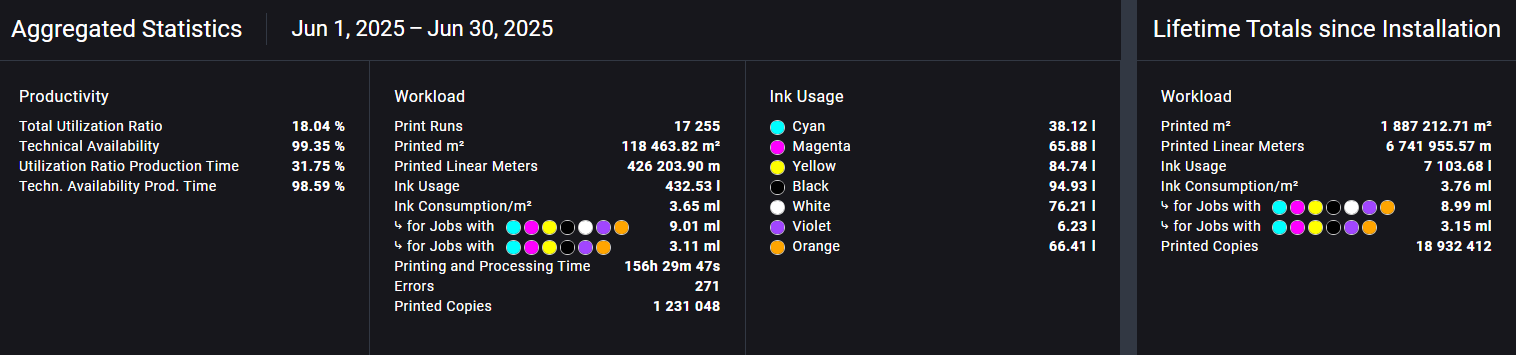
Productivity
This section shows:
- Total Utilization Ratio and Technical Availability calculated over a full 24/7 period.
- If a shift plan is defined, additional metrics will appear:
- Utilization Ratio Production Time
- Technical Availability Production Time
These values provide more accurate insight during scheduled working hours only.
If no shift plan is visible, it may be because none has been configured for the selected printer.
Please refer to the Shift Plan Setup Guide to learn how to define one.
Workload
The Workload section displays job and performance metrics for the selected time range, such as:
- Total print runs
- Printed m² and lm
- Ink usage
- Ink consumption per square meter
- Job errors
- Total printed copies
If your machine uses spot colors like white or varnish, you will see:
- Ink Consumption/m²: aggregated for all jobs
- Ink Consumption/m² for jobs with spot colors
- Ink Consumption/m² for jobs without spot colors This breakdown helps distinguish regular jobs from special-color jobs.
Ink Usage
Displays the amount of ink used per color within the selected timeframe.
Lifetime Totals
The right panel shows overall production statistics from the printer’s installation date to today. These metrics mirror the workload section but on a cumulative basis.
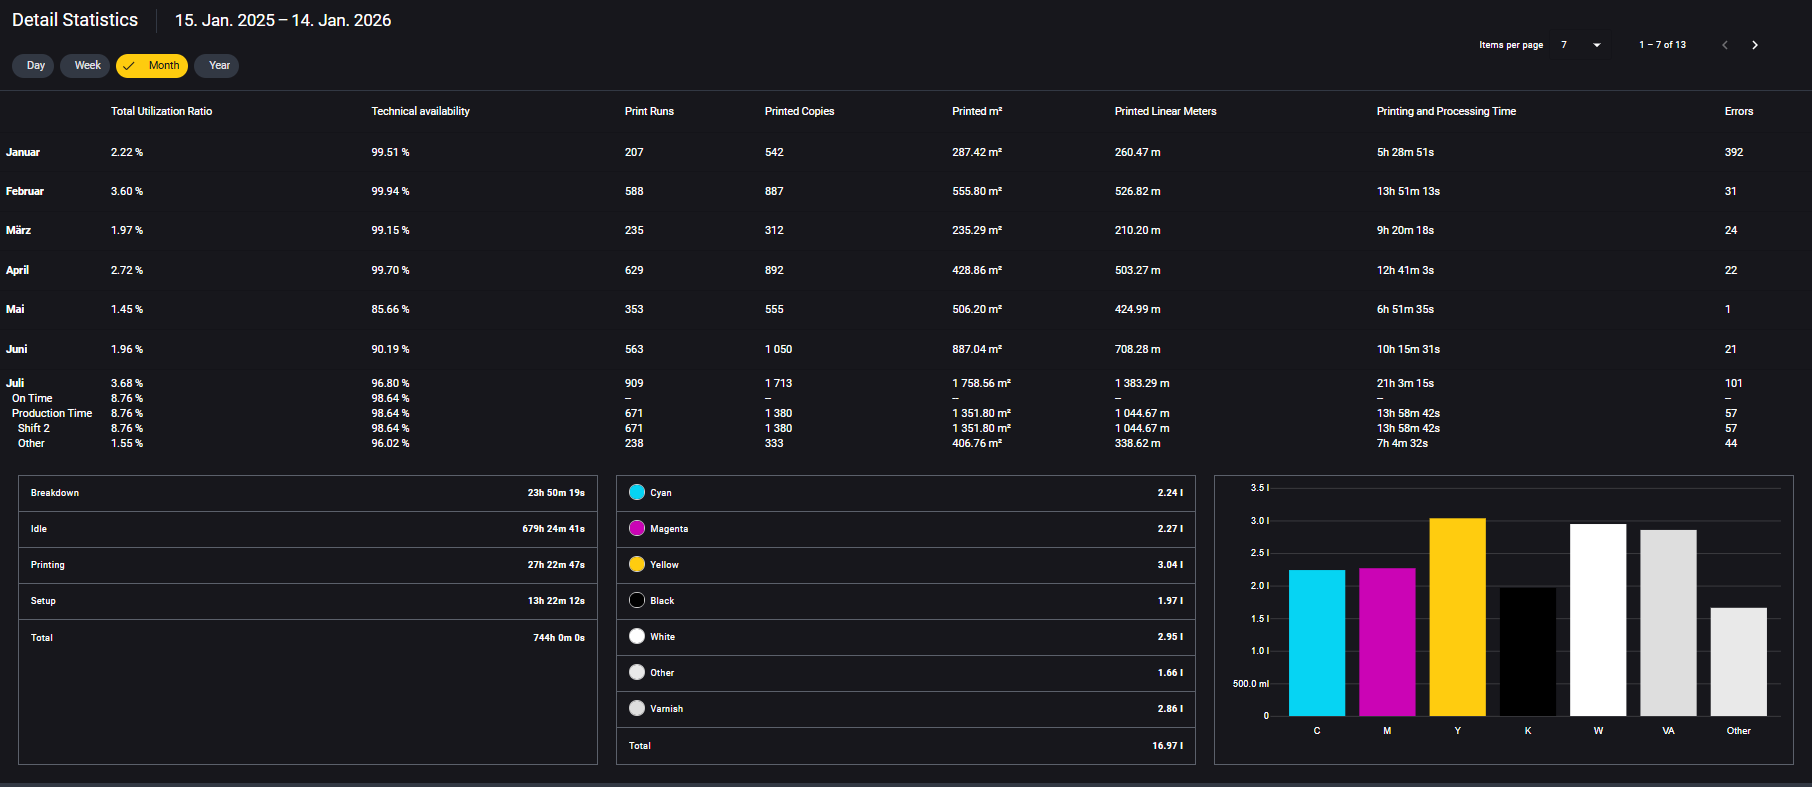
Detail Statistics
The Detail Statistics section provides deeper insights into your selected time period. Use the view toggles to group data by:
- Day
- Week
- Month
- Year
Each time block includes key KPIs like utilization, availability, print runs, copies, print volume, and more. You can expand individual time blocks to view a full breakdown of:
- Print states: Setup, Printing, Idle, Breakdown
- On Time
- Shift distribution
- Ink usage per color
KPI Definitions
| KPI | Description |
|---|---|
| Total Utilization Ratio | Time spent in production-related states (Printing) relative to total time (24/7). |
| Technical Availability | Percentage of time the printer was operational (excluding breakdowns) (24/7). |
| Utilization Ratio Production Time | Utilization during defined production time (requires shift plan). |
| Technical Availability Prod. Time | Availability during defined production time (requires shift plan). |
| Print Runs | Total number of print runs (every start of a job counts as a run) |
| Printed m² | Total printed area in m² |
| Printed Linear Meters | Total lm printed. |
| Printing and Processing Time | Total time the printer was actively printing or processing print jobs. |
| Printed Copies | Total number of printed copies. |
| Errors | Number of logged error messages during the selected period. |
| Ink Usage (per color) | Amount of ink used per color (Cyan, Magenta, Yellow, Black, White, etc.). |
| Ink Consumption/m² | Total ink usage per square meter across all jobs. |
| Ink Consumption/m² with spot | Ink usage per m² for jobs that include spot colors (for example: White, Varnish). |
| Ink Consumption/m² without spot | Ink usage per m² for jobs that don't include spot colors. |
For metrics like Printed m², Printed Linear Meters, and Ink Usage, only completed copies are counted.
If a copy is interrupted by an error or manually stopped by the operator, its partial values won't be included.
This ensures that output metrics reflect only fully produced, sellable output.