Main Navigation
This section describes the main navigation in Durst Analytics. It provides access to key areas of navigation functions of the application. The main navigation consists of a header and a sidebar.
The main navigation is available on every page of the application, allowing you to quickly access different sections and features. Where the header provides global actions and information, the sidebar offers access to specific sections related to printer data and administrative functions.
Navigation Header
The header consists of two main areas:
- Left Side Header: Displays general information.
- Right Side Header: Contains global actions.

Left Side Header
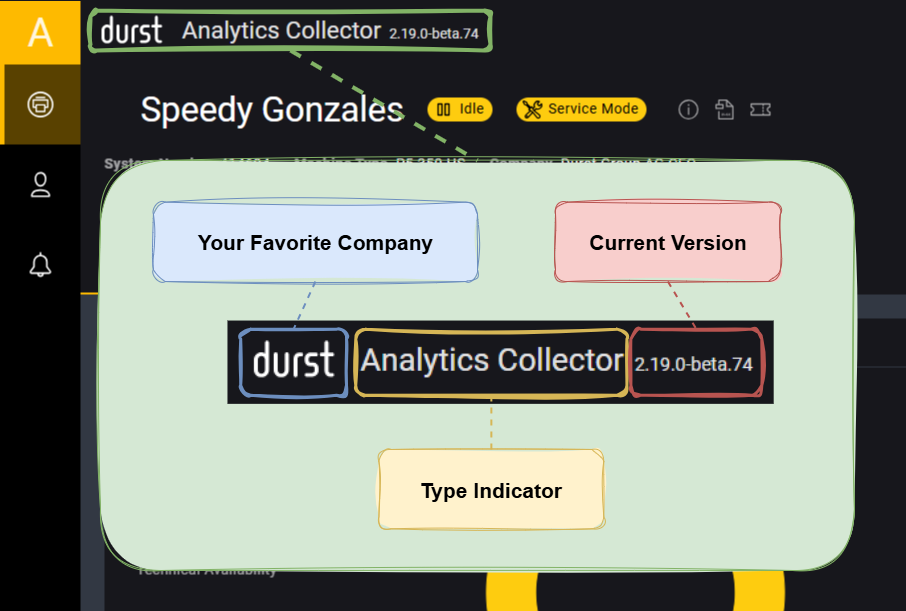
Type Indicator
Displays the name and type of the application.
- If you open the browser on your local machine and connect directly to the Collector, the full name will be displayed ( for example: "Analytics Collector").
- If you access the Analytics cloud interface, only "Analytics" will be shown.
Current Version
Shows the current version of the application.
A Collector instance connected to the cloud will always stay updated to the latest version.
Right Side Header
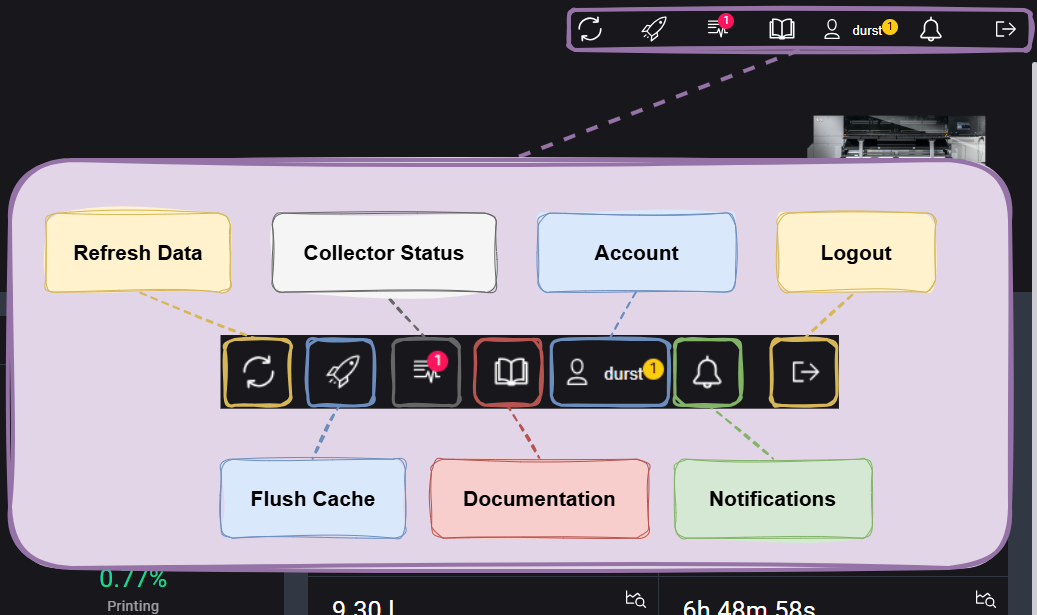
Refresh Data
The dashboard refreshes automatically every 30 seconds. Click this button to manually trigger a data refresh.
Flush Cache
Clears the local cache of the application.
This is especially helpful after updates if some outdated fragments are still cached locally.
Collector Status
Opens an overlay with the current status of the Collector and an option to manually check for issues.
- A red indicator means there are critical issues.
- The number in the red circle indicates how many issues were found.
Documentation
This will open the documentation page in a new browser tab.
Account
Shows the account name you are logged in with.
Clicking this opens a summary view of your account with a button to access account settings.
- A yellow indicator means there is a warning or recommended action for your account.
- Unlike red indicators, this isn't critical.
Notification Bell
Displays the status of background tasks such as data exports.
- A yellow circle with a number indicates how many exports are currently in progress.
- Once completed, the indicator turns green, and the export can be downloaded.
Logout
Logs you out of the application and redirects you to the login page.
Sidebar Navigation
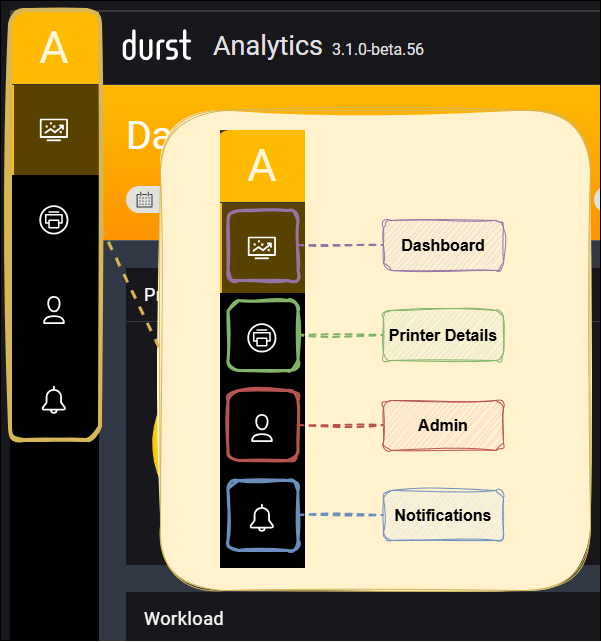
The sidebar provides access to different sections of the application (image represents Collector View). It's divided into the following main areas:
Dashboard
The Dashboard tab provides machine-wide, fleet-level views designed to give you a quick and clear overview of your entire printer fleet.
-
Dashboard
A high-level overview of all printers, including key performance indicators and overall status summaries. -
Ink Dashboard
A fleet-wide view of ink health across all machines. It shows whether inks are in good condition, close to expiration, already expired, or currently under service monitoring.
Printer Details
This is also the main page of the Collector and contains all printer-related data. By hovering over the icon, a submenu will appear with the following options:
-
Overview
General overview of the printer's status, performance, and key metrics. -
Printer Jobs
Displays a list of all jobs processed by the printer, including job status, duration, and material used. -
Used in Batches
Shows a history of all loaded ink batches, including fill date, batch number, and more.
It also displays the currently loaded ink batches and whether they're within the expiration range. -
Maintenance
Lists all maintenance-related messages, such as required actions, warnings, and error history. -
Productivity
Displays a timeline per day showing the printer's operational status, with detailed information available via hover tooltips. -
KPI
Displays the Key Performance Indicators (KPIs) of the printer, such as uptime, utilization, error rates, and lifetime totals.
Printers
Provides a tabular overview of all printers, including their current status and other relevant details. An Admin can assign Tag's in this section to the printer, like that you can create custom groups of printers.
Admin
Contains administrative functions for managing the Collector. The submenu includes:
-
Settings
Configuration options such as language, date format, measurement units, and more. -
My Account
Displays your account information and allows you to change your password. -
Shift / Production Time
Enables you to define shift times for your printer in order to narrow down data analysis to specific time frames.
Notifications
- Downloads
Shows a history of all Excel exports you’ve generated and allows you to download them again.
REST API Management
Only Admins can see this section.
In this section if you are subscribed to the Analytics + plan you can create and manage API keys to access the REST API.