Printer Details Overview
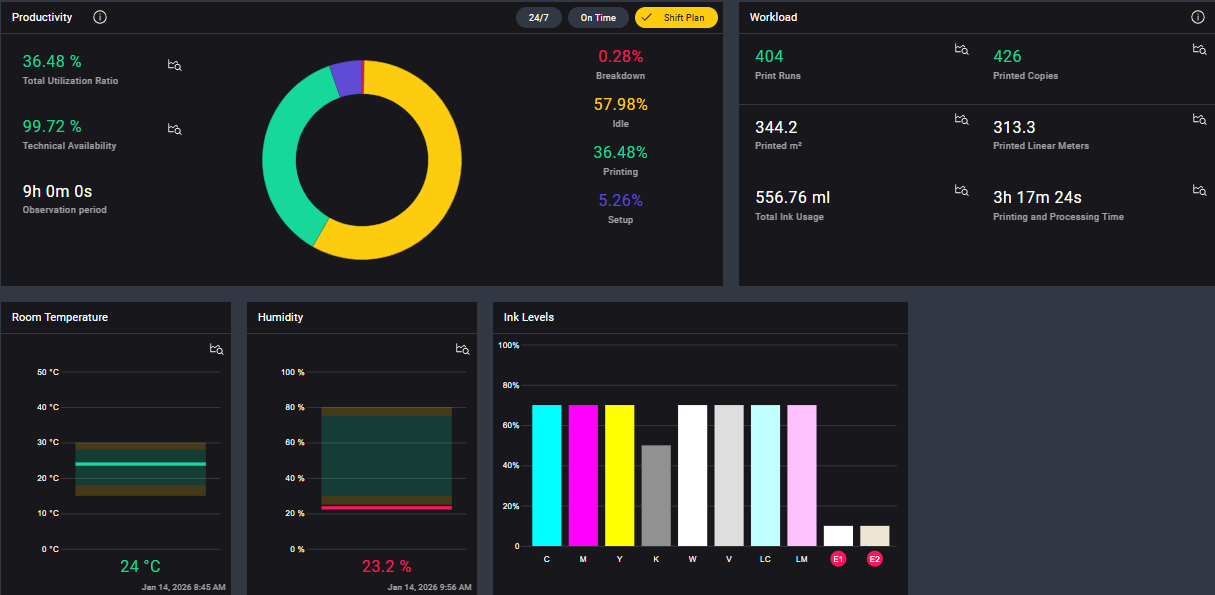
The Printer Details Overview section provides a high-level summary of the printer's operational status, key performance indicators, and recent activity. It serves as the landing page for each printer's details, offering a quick snapshot of its performance and overall health.
Depending on the printer type, the overview may vary slightly, but it generally includes the following key components:
- Productivity: Displays the printer's productivity metrics, such as technical availability, average print time, and efficiency rates.
- Workload: Shows the total workload processed by the printer, including the number of print runs completed, total printed area (m²), and overall print time.
- Ink Levels: Provides an overview of the current main tank levels for each color, indicating whether they're within normal operating ranges.
Optional additional components may include:
- Circulation Pumps: Displays the status of the circulation pumps, including their operational state and any alerts.
- UV Lamps: Shows the usage of UV lamps, including remaining lifetime and replacement status.
- Room Temperature: Displays the current ambient temperature, which can affect print quality and system performance.
- Room Humidity: Shows the current room humidity level, which can also impact material handling and print quality.
- Material Speed: Displays the current material feed speed the printer is running at.
Productivity
The Productivity section provides insights into the printer's operational efficiency.
By clicking the ![]() icon, you can open an overlay with a quick overview of the Productivity section.
icon, you can open an overlay with a quick overview of the Productivity section.
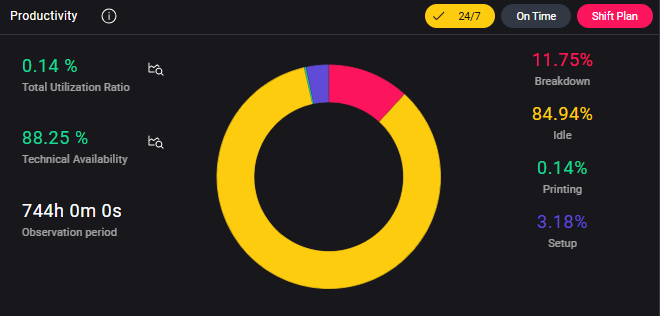
Status
The status percentages shown on the right are calculated based on the time frame selected in the global filter. By default, the calculation uses a 24/7 observation window and shows how much time each status occupied within the selected period.
You can narrow down the observation window using one of the following options:
-
On Time
Limits the calculation to periods when the printer was initialized and powered on. -
Shift Plan
Restricts the calculation to the shift plan configured in your collector.
If the Shift Plan chip is shown in red, no shift plan is currently configured. Please refer to the Shift Plan Setup Guide to learn how to define one.
By hovering over the different sections of the productivity ring, you will see the exact duration of each status in the format:
Status xx% hh:mm:ss
| Icon | Description |
|---|---|
| The printer is actively printing a job. | |
| The printer is online and ready, but not currently printing. | |
| The printer is preparing for a job (for example: loading material, purging ink). | |
| The printer is in an error state and requires attention. |
Technical Availability and Utilization
-
Technical Availability represents the percentage of time the printer was available for production, meaning it wasn't in an error state.
It's calculated as:
(Printing Time + Idle Time + Setup Time) / Observation Period
Or, in simpler terms:
Printing% + Idle% + Setup% = Technical Availability% -
Total Utilization Ratio indicates how much of the selected time range was spent actively printing.
It's calculated as:
Printing Time / Observation Period
Or, simply:
Printing% = Total Utilization Ratio%
By clicking on the ![]() icon next to Technical Availability or Total Utilization Ratio, you can view a time-based diagram that shows the historical progression of these metrics across the selected time frame.
icon next to Technical Availability or Total Utilization Ratio, you can view a time-based diagram that shows the historical progression of these metrics across the selected time frame.
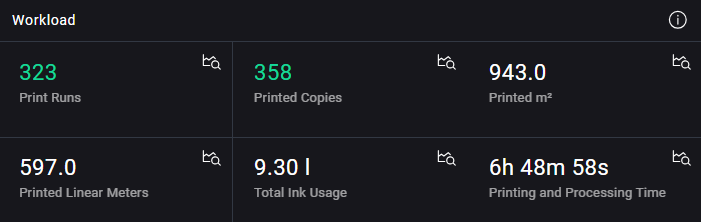
Workload
The Workload section provides a summary of key production output metrics over the selected time frame.
By clicking the ![]() icon, you can open an overlay with brief explanations of each metric shown in this section.
icon, you can open an overlay with brief explanations of each metric shown in this section.
Each card includes a ![]() icon, which opens a time-based diagram to visualize how the corresponding metric evolved during the selected period.
icon, which opens a time-based diagram to visualize how the corresponding metric evolved during the selected period.
All values shown are filtered based on the global Time Range and Job Category selections.
The metrics displayed include:
-
Print Runs
The number of print jobs started during the selected time frame.
A print run is counted every time a job is started in the queue, regardless of whether it completes.
If the same job is started multiple times, each start counts as a separate print run. -
Printed Copies
The total number of copies produced across all jobs. -
Printed m²
The total printed area, measured in m². -
Printed Linear Meters
The total printed length of media, measured in lm. -
Total Ink Usage
The total volume of ink consumed for completed jobs, measured in liters.
Ink used for maintenance, cleaning, or aborted jobs isn't included. -
Printing and Processing Time
The total time spent printing and processing jobs, shown inhh:mm:ssformat.
This includes job startup and preparation time (for example: head movement, heating).
For multi-line machines, overlapping jobs are handled correctly.Paused JobsPaused Jobs aren't yet tracked with a dedicated pause timer. As a result, Printing and Processing Time may appear longer than the actual active printing time when a job remains paused for an extended period.
This limitation affects all machine types except those running Platform Software with MQTT, where pause handling is properly supported.
Ink Levels
This section displays the current levels of the main ink tanks, shown in the same sequence as the inks are loaded into the machine’s main tanks.
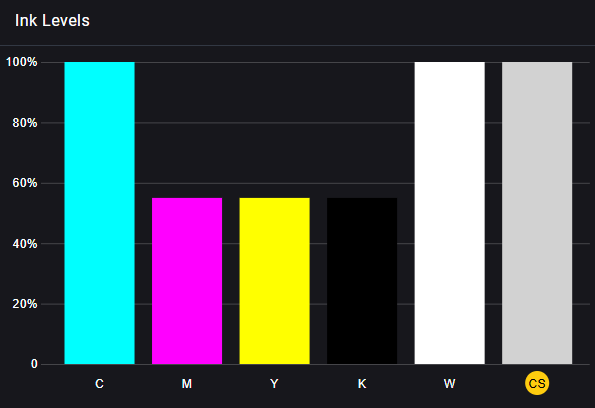
By hovering over the color bars, a tooltip will show the ink level as a percentage of the tank capacity.
If the color label on the x-axis appears with a yellow background, it indicates that the ink will expire soon. In this case, it's recommended to either use or drain the ink batch before expiration. For further assistance, you can contact the service department.
If the label is accompanied by a red circle, the ink is already expired.
Using expired ink can lead to poor print quality, potential damage to the printhead, and may void the printer’s warranty.
By clicking on any of the color bars, an overlay will open with detailed information about the ink batch, including:
- Batch Number
- Filling Date
- Expiration Date
- Barcode
Circulation Pumps
This section provides insight into the printer’s circulation pumps, which are essential for maintaining stable ink flow and ensuring consistent print quality. It displays each pump's operating percentage and the recommended operational thresholds.
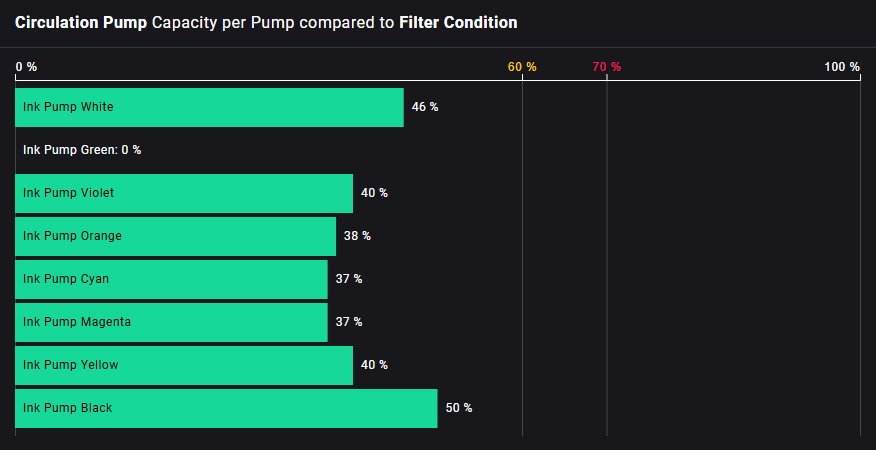
The diagram gives an overview of the current pump status, highlighting whether any pumps require attention.
- If a pump exceeds the warning threshold, maintenance actions should be considered and spare parts should be kept in stock.
- If a pump reaches the error limit, immediate maintenance is required.
If circulation pumps reach the error limit, this may result in poor print quality and potential damage to the printhead.
By clicking on a pump card in the diagram, a detailed overlay opens showing a time series chart of the pump’s activity:
- Displays the last 7 days of data or, if more than 500 records exist, the most recent 500 data points.
- Helps monitor trends in circulation performance over time.
The diagram always displays the full set of configured colors (maximum: 8), even if your machine uses fewer channels.
In that case, unused channels will appear as 0%.
If the machine is shut down, all pumps will display 0% operational, as circulation is inactive during shutdown periods.
UV Lamps
This section provides an overview of the printer’s UV lamps, which are critical for curing UV inks during the printing process.
It functions as an hour counter, tracking the total operating time for each lamp and comparing it against predefined warning and error thresholds.
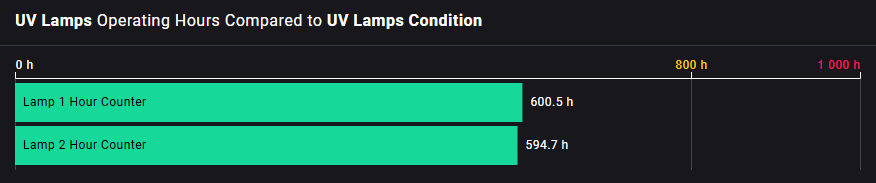
- When a lamp approaches the warning limit, it's recommended to have replacement lamps available in stock.
- If a lamp reaches the error limit, maintenance is required to avoid production issues.
By clicking on a lamp card in the diagram, a detailed overlay opens showing a time series chart of lamp usage:
- Displays the last 7 days of data or, if more than 500 records exist, the most recent 500 data points.
- Helps monitor wear trends over time and plan maintenance proactively.
If a UV lamp exceeds the error limit, it may result in insufficient ink curing, leading to reduced print quality and potential print failures.
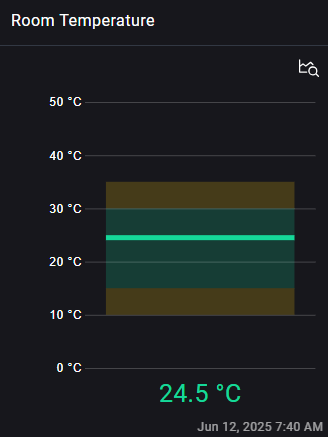
Room Temperature
The Room Temperature section displays real-time data on the ambient temperature in the printer’s environment.
Maintaining the correct temperature range is essential for ensuring consistent print quality and machine performance.
By clicking on the temperature card, a detailed overlay opens showing a historical time series:
- Displays the last 7 days of data or, if more than 500 records exist, the most recent 500 data points.
- Helps detect environmental fluctuations that may affect printing conditions.
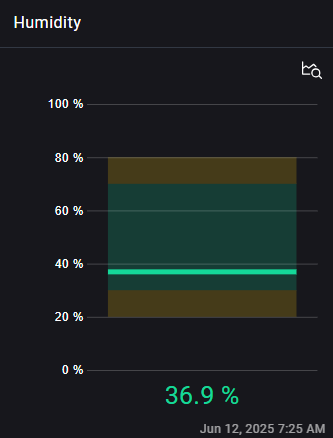
Room Humidity
The Room Humidity section shows real-time humidity levels in the printer’s environment.
Humidity can impact ink behavior, drying, and overall print consistency, especially for sensitive materials.
Clicking on the humidity card opens a historical overlay chart:
- Displays the last 7 days of data or the most recent 500 data points, if applicable.
- Useful for identifying trends or deviations that could influence print quality.