Compare Machines
The Compare Machines feature lets you compare key performance indicators (KPIs) across multiple machines, machine types, locations, and time ranges.
Its purpose is to help you identify trends, outliers, and performance differences by viewing machines side by side.
Global Filters
Use the global filters at the top of the page to define which machines and which time range you want to analyze.
Typical filters include:
- Time range
- Plant
- Machine Segments
- Machine Types
- Machine Tags
The selected filters apply to all machines in the comparison.
Group by
The Group by option defines the granularity of the comparison. You can group data by, for example:
- System number
- Plant
- Machine Type
- Machine Segment
After selecting a grouping, you can add between 2 and 5 groups to compare side by side.
Each group represents one comparison entity, such as a machine or a production side.
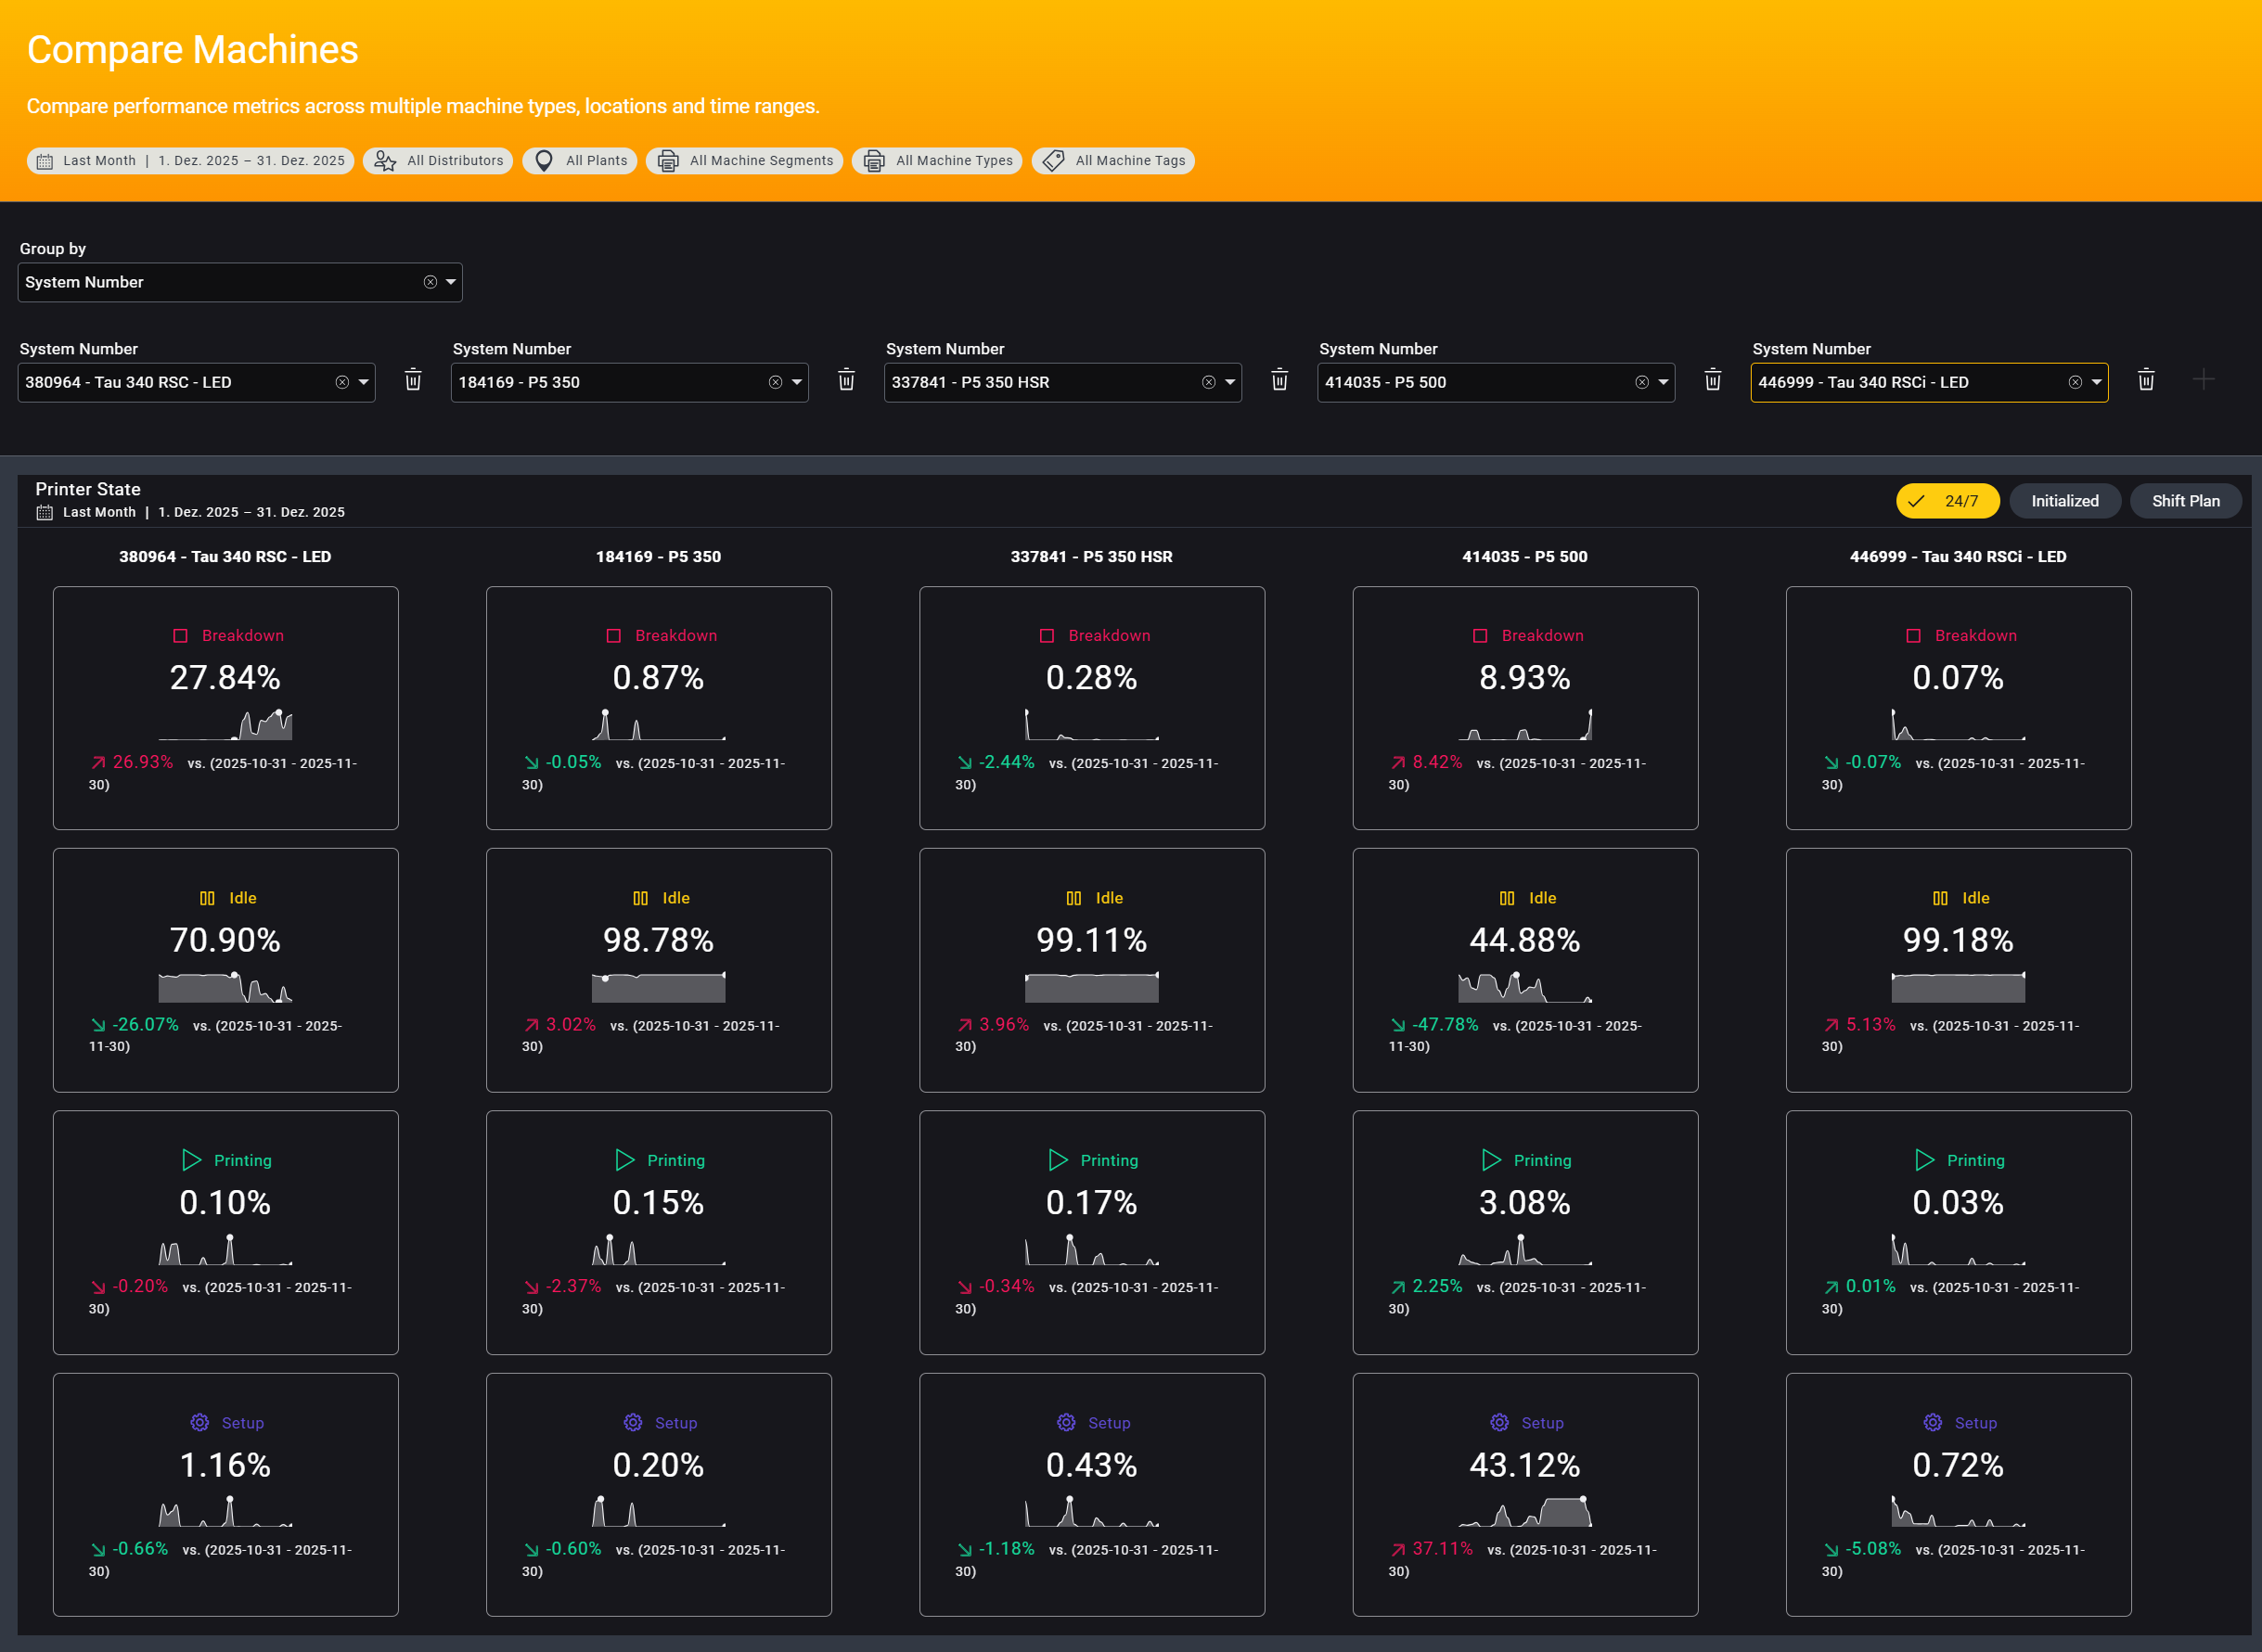
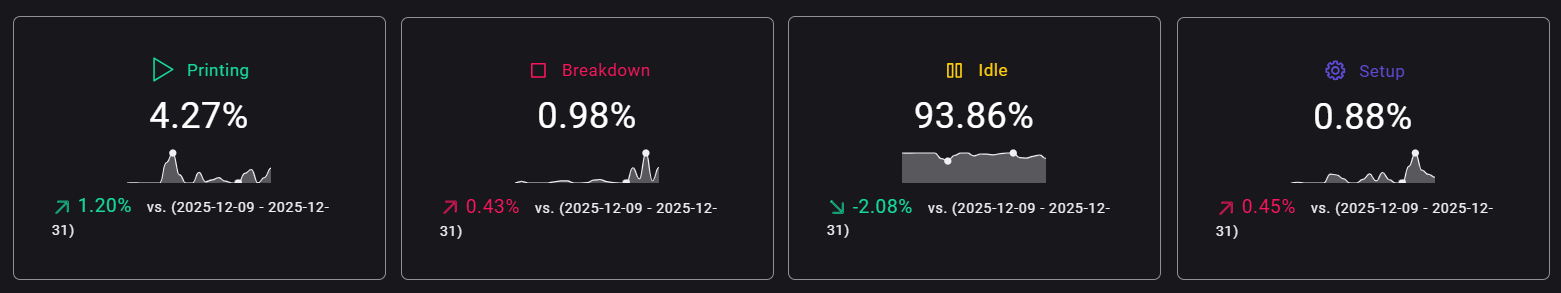
KPI Cards
Each KPI card displays:
- The current value for the selected time range
- A trend diagram
- The percentage change compared to the previous period
The comparison period depends on the selected time range:
- For a monthly range, the percentage compares the selected month to the previous month
- For a multi-day range, it compares the selected period to the immediately preceding period of the same length
Arrow colors are metric-dependent:
- A decrease in Breakdown time is shown in green
- A decrease in Printing time is shown in red
This ensures that improvements and degradations are interpreted correctly.
If you select a single day, no diagram is displayed because there isn't enough data to generate a meaningful chart.